BondWave, a leading financial technology firm servicing the fixed income market, has calculated up to eight pricing benchmarks for every customer trade disseminated by FINRA and the MSRB for asset classes requiring mark-up disclosure dating back to 2018. This Universal PMP data set is part of BondWave’s Benchmark Data & Trading Indices (BDTI), now known as QMarksTM.
Starting with Q4 2020, BondWave began producing dashboards for each of the four covered asset classes (corporate, municipal, agency, and 144A bonds) with plans to expand coverage to securitized products (MBS, ABS, CMO, etc.).
A new feature was added to the dashboards in Q2 2021 showing the weighted average number of levels of the waterfall for which we were able to produce a PMP calculation.
The dashboards will help market participants better understand trading trends in the fixed income markets.
Second Quarter 2021 UPMP Dashboards
Corporate
Observations:
- In the second quarter we produced an average of 4.2 (of 8 possible) PMP calculations per corporate trade.
- The second quarter saw a decline in both the number of customer trades (-8.55%) and the total par traded (-13.02%) relative to the first quarter.
- Meanwhile, mark ups recovered in the second quarter (+11.51%) while mark downs continued to ease (-2.24%).
- The average bid/ask spread also decreased by 15.85% to 39.8 basis points.
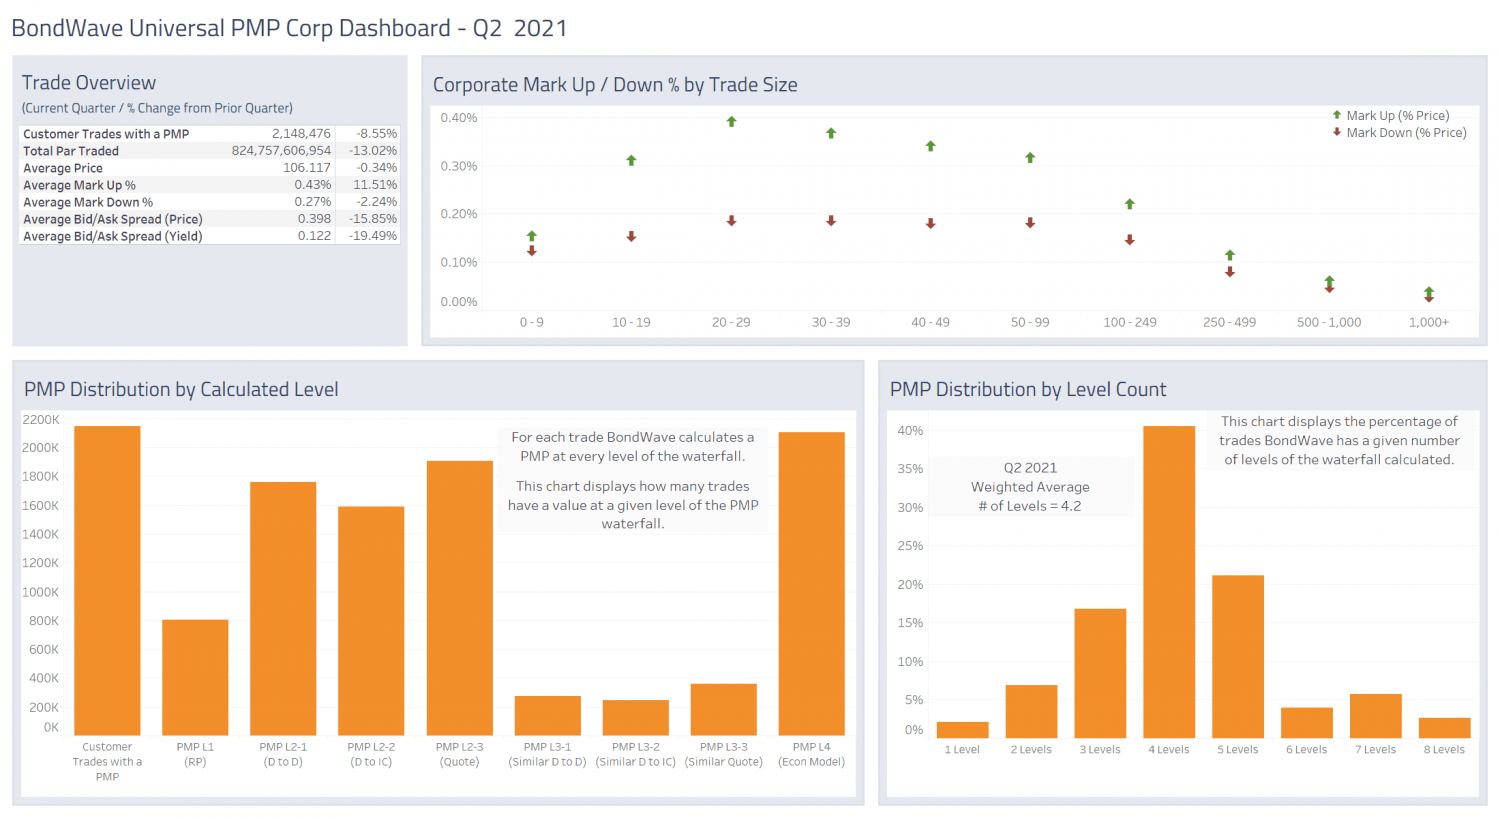
Source: BondWave BDTI data
Municipal
Observations:
- In the second quarter we produced an average of 2.4 (of 8 possible) PMP calculations per municipal trade.
- The second quarter saw a decline in both the number of customer trades (-4.09%) and the total par traded (-6.69%) relative to the first quarter.
- Meanwhile, mark ups recovered modestly in the second quarter (+0.45%) while mark downs continued to ease (-2.43%).
- The average bid/ask spread also decreased by 4.10% to 59.4 basis points.
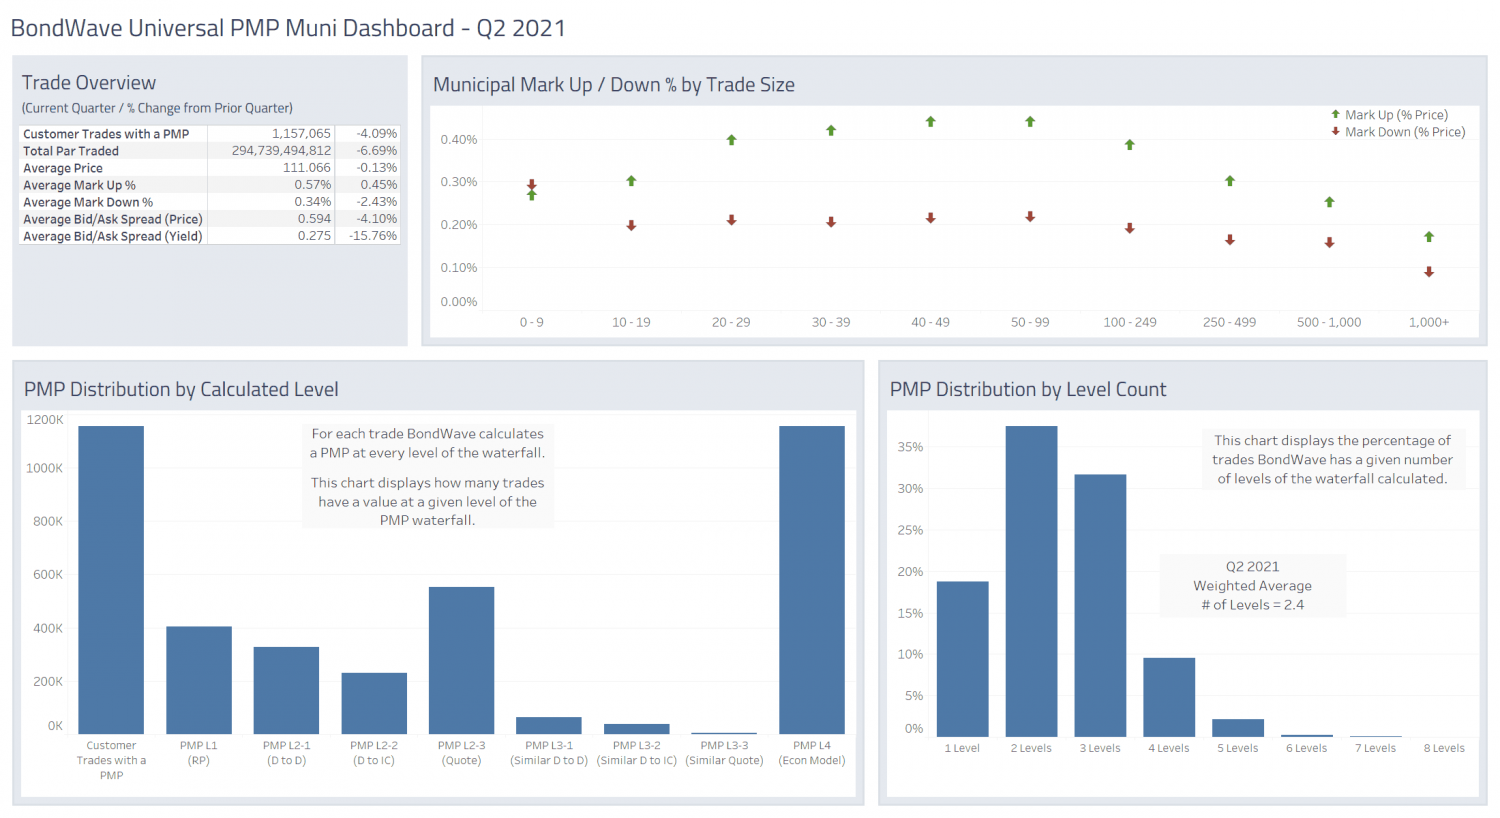
Source: BondWave BDTI data
Agency
Observations:
- In the second quarter we produced an average of 4.3 (of 8 possible) PMP calculations per agency trade.
- The second quarter saw a decline in both the number of customer trades (-14.20%) and the total par traded (-18.31%) relative to the first quarter.
- Mark ups (-4.37%) and mark downs (-3.24%) followed a similar trajectory.
- Meanwhile the average bid/ask spread increased by 9.05% to 21.1 basis points.
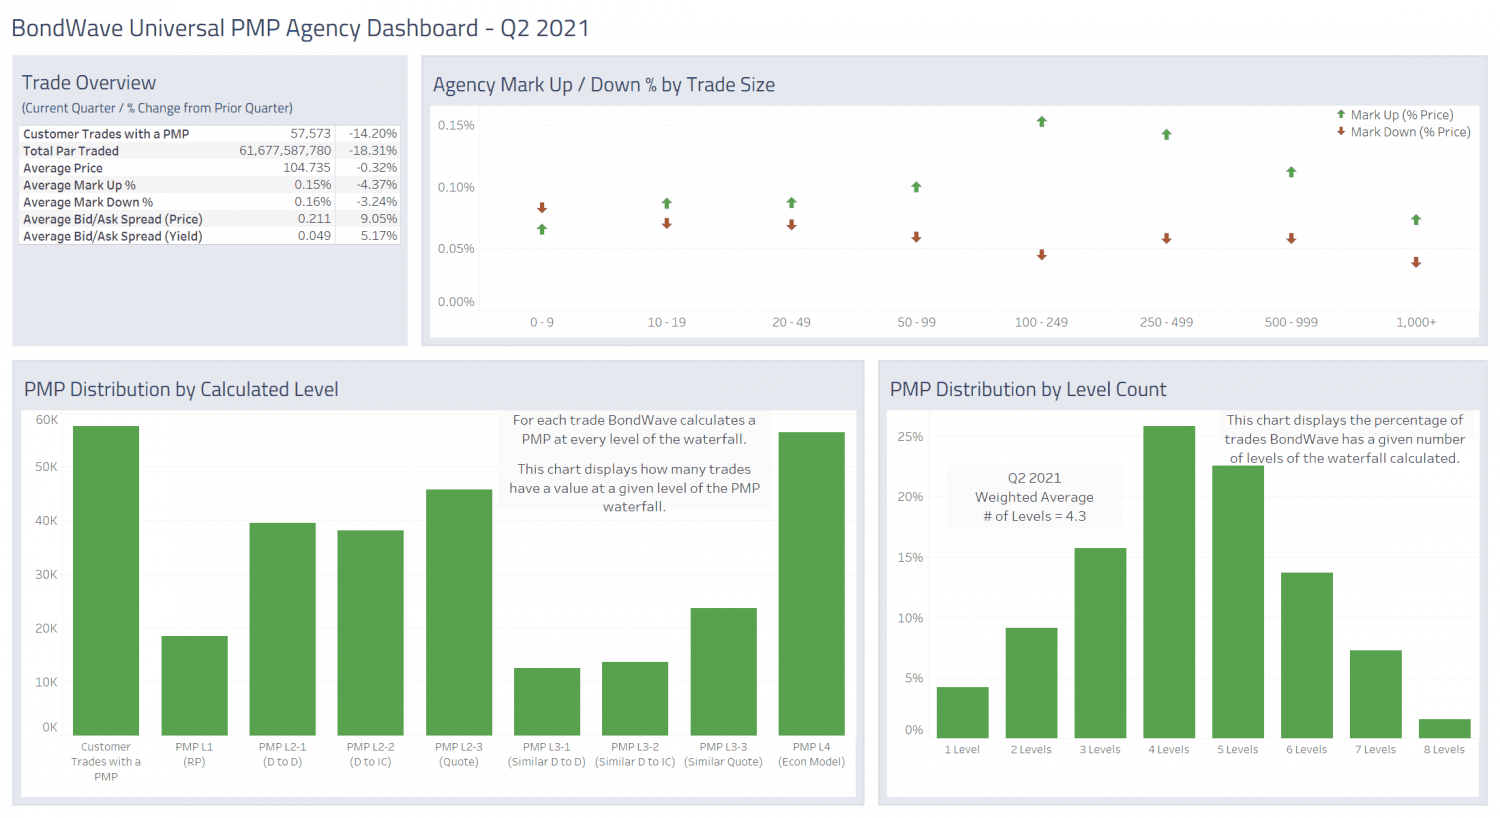
Source: BondWave BDTI data
144A
Observations:
- In the second quarter we produced an average of 3.2 (of 8 possible) PMP calculations per 144A trade.
- The second quarter saw a decline in both the number of customer trades (-3.91%) and the total par traded (-11.19%) relative to the first quarter.
- Meanwhile, mark ups recovered in the second quarter (+21.74%) while mark downs continued to ease (-2.22%).
- The average bid/ask spread also decreased by 14.70% to 37.1 basis points.
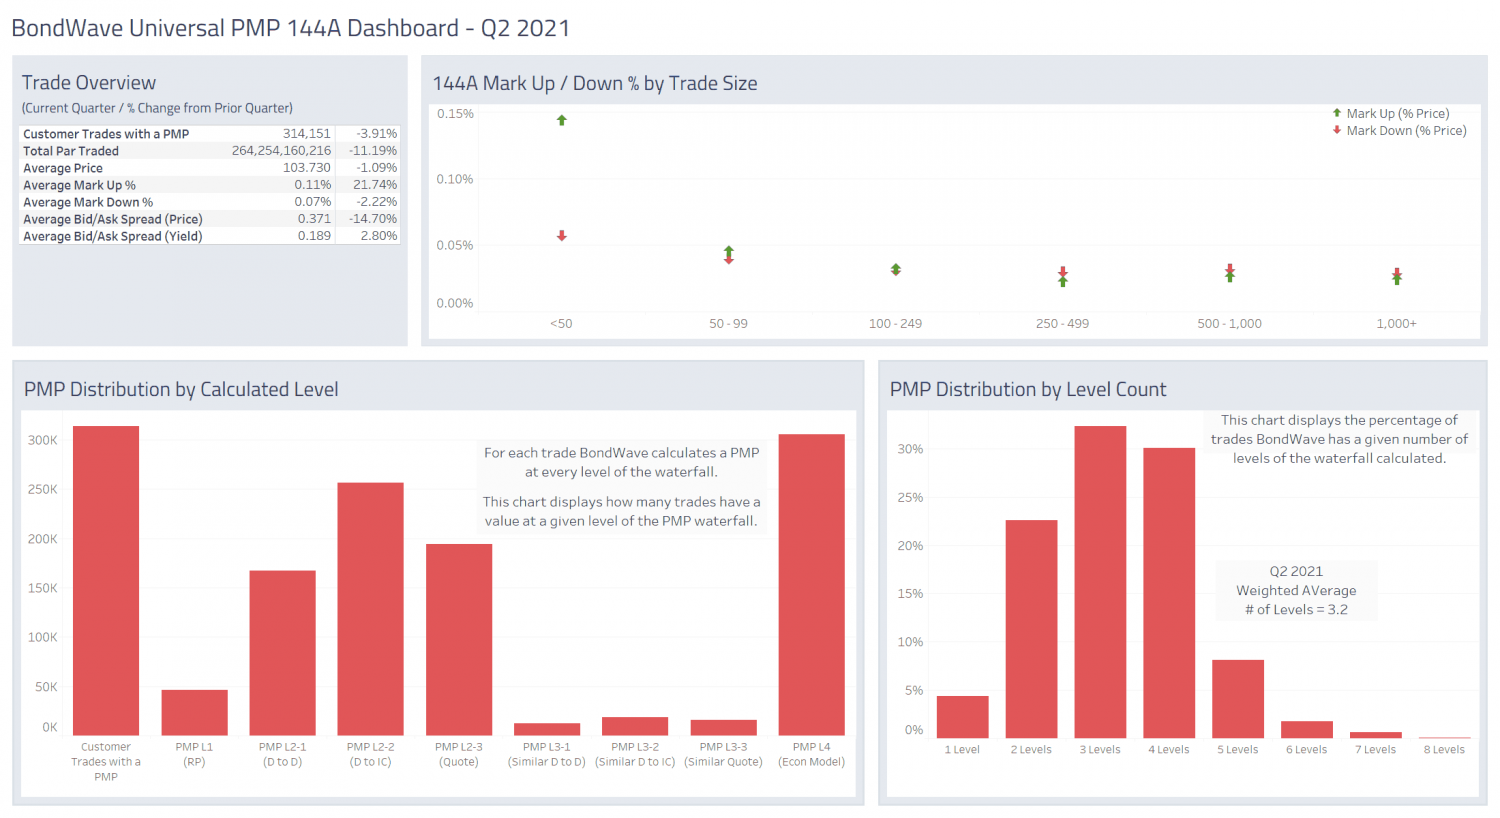
Source: BondWave BDTI data
