Introduction
Fixed income quotes have multiple use cases; they are used for regulatory purposes such as fair pricing and best execution, portfolio valuations, buy and sell decisions, trade negotiations and transaction cost analysis, making them a critical input to investment decisions. Unlike the equity market, these quotes are almost always indicative. Some fixed income markets show two-sided quotes. Some markets show one-sided quotes. And some markets show no quotes at all. Most notably, there is no single market mechanism to aggregate quotes from all available sources to create a national best bid and offer. At any one point in time, a bond trader has a limited view to “the market” as defined by all available quotes.
We questioned the degree of quality of these quotes as measured by the difference between the price of a bond as indicated by a quote and the price as indicated by a subsequent trade. Are fixed income quotes a true indication of the price at which a dealer is willing to execute a trade? Or should they be viewed as invitations to negotiate? If quotes are to be relied upon for all the purposes listed above, it is important to understand their nature and to answer these questions.
Data
In this paper we examine the relationship between corporate bond quotes and trades in the inter-dealer marketplace by comparing quote prices and sizes from a single ATS to dealer-to-dealer trade prices and sizes as disseminated by FINRA for the period January 1, 2021, through August 31, 2021. In a follow-up paper we will perform the same analysis for municipal bonds.
We only use dealer-to-dealer trades in this analysis to remove the pricing bias introduced by the inclusion of mark-ups and mark-downs in customer trades. Furthermore, because the ATS we pull prices from is a dealer-to-dealer market it is logical that we filter our trade set to only include dealer-to-dealer trades.
To be included for our analysis, a dealer-to-dealer trade must also be part of a riskless principal pair. This requirement allows us to designate side-of-market for the dealer-to-dealer trades by using the side-of-market for the associated customer leg in the pair. For example, if there is a dealer-to-dealer trade at approximately the same time and for the same size as a purchase-from-customer trade, then the dealer-to-dealer trade will be classified as a sell and compared to the existing bid. If, however, there is a dealer-to-dealer trade at approximately the same time and for the same size as a sale-to-customer trade, then the dealer-to-dealer trade will be classified as a buy and compared to the existing offer.
We use only the best bid and offer available from a single ATS. By ignoring bids and offers behind the best bid and offer we may miss effects that can be explained by size differences between the desired trade and the best quote. For example, if a desired trade is larger than the best quote, it is possible that a trader would move to the next best quote that completes their order rather than execute the order in multiple pieces. This may be done for a variety of reasons (to avoid information leakage, or to create operational efficiency, for example). Also, if a desired trade is smaller than the best quote it is possible that the quote has a minimum fill quantity that would prevent the desired trade from executing against it. Finally, due to the presence of counter-party filtering in the fixed income market, a desired trade may not even be aware of the existence of what we consider to be the best quote in this study as our quote data has no counter-party filter applied.
Our match between dealer-to-dealer trades and quotes is contingent on the presence of a quote on a single fixed income ATS. Because only a single ATS is used in the analysis and only dealer-to-dealer trades that are part of a riskless principal pair are used, only a subset of disseminated trades are analyzed using this method. During the relevant time period there were 4,031,208 corporate dealer-to-dealer trades disseminated by FINRA. Of these 2,655,973 (65.9%) were assigned side-of-market designations using the method described above. Among the subset of dealer-to-dealer trades assigned a side-of-market designation 1,737,333 (43.1% of total, 65.4% of designated subset) also had a live same side-of-market quote available at the time of trade.
Once the trade/quote pairs have been established we calculate the percentage deviation between the quote price and the trade price without normalizing for side-of-market. This allows us to view price improvement for bids and offers on opposite sides of the horizontal axis in the same graph. This simple metric will provide our measure of quote quality. In our framework, the closer the ultimate trade price is to the quote (and the closer our metric is to 0), the higher the quality of the quote.
Quote Quality = (Quote Price / Trade Price) – 1
- For buys:
- a positive value means the trade was price improved relative to the offer.
- a negative value means the trade was executed through the offer.
- For sells:
- a negative value means the trade was price improved relative to the bid.
- a positive value means the trade was executed through the bid.
Results
For the time period January 1 to August 31, 2021, corporate bond offer prices averaged 14 basis points higher than executed buys in the dealer-to-dealer market and bid prices averaged 30 basis points lower than executed sells. Said another way, trades received an average of 14 basis points of price improvement for buys and 30 basis points of price improvement for sells.
By way of illustration, we include a graph of quotes (lines) and trades (dots) in a single CUSIP across a three-day period in February. The majority of trades in this example occur at prices inside of the quoted bid/offer spread. For buys, 21 of 34 (61.8%) trades occur at prices better than the best offer. For sells, 21 of 23 (91.3%) trades occur at prices better than the best bid.
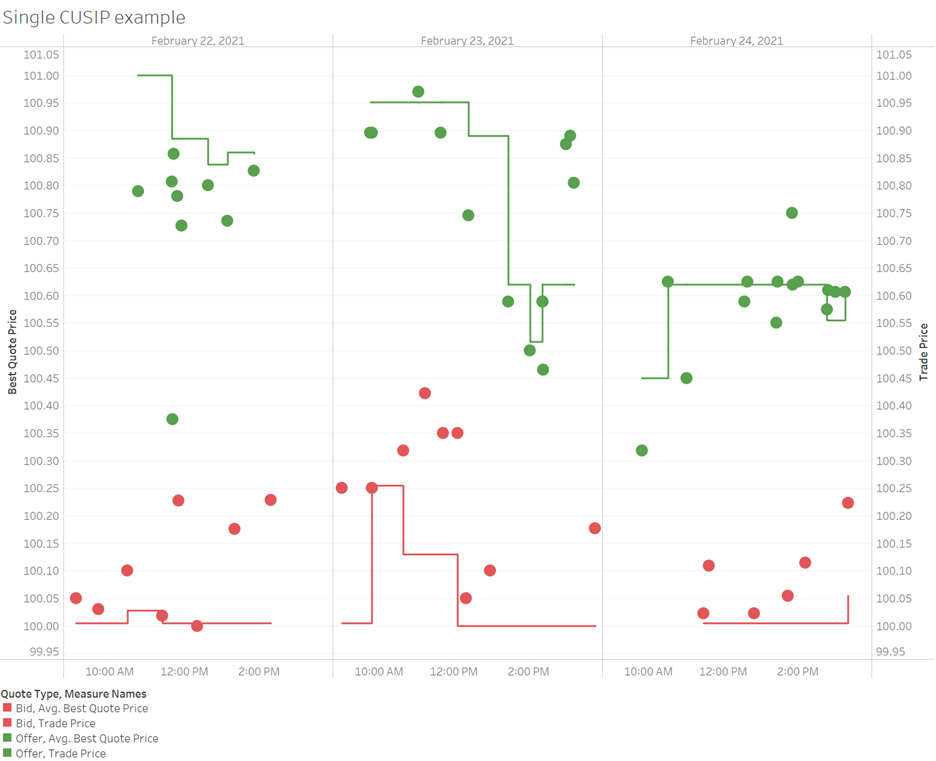
Source: FINRA, BondWave BDTI
Across our data set, for 85.6% of bids and 73.3% of offers, trades occurred at better prices than the quotes. For 2.6% of bids and 7.5% of offers, trades occurred at the same price as the quote. And for 11.8% of bids and 19.1% of offers, trades occurred at prices worse than the quote.
Quote Quality by Rating and Trade Size
Fixed income pricing has been shown to be both size and ratings sensitive. Larger trades tend to receive more favorable pricing than smaller trades. And investment grade bonds are less volatile than high yield bonds making posting bids or offers in investment grade bonds less risky. We bucketed the data by rating and trade size to determine relative effects. While all trade sizes and rating types receive price improvement on average, large sell trades ($5,000,000 and up) do not receive disproportionate price improvement and large purchases receive only modestly more price improvement than smaller trades.
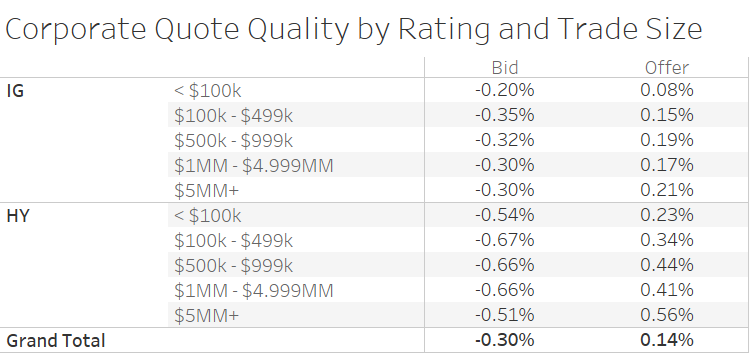
Source: FINRA, BondWave BDTI
Quote Quality by Rating and Quote Size
In practice the quote precedes the trade. An underlying assumption is that the presence of the quote is what causes the trade to occur. Therefore, we also want to examine the effect of quote size on price improvement. Here the relationship between size and price improvement is clearer. For large trades our metric deems the quotes are more efficient (they are posted at prices that are very close to the ultimate trade prices). There is one notable exception though that points to the difficulty of working with sparse fixed income trade data. For high yield offers of $5,000,000 or more the price improvement averages 37 basis points, the highest of any offer side quote size category. However, this is based on only 7 observations during our 8-month window and should be viewed as an outlier.
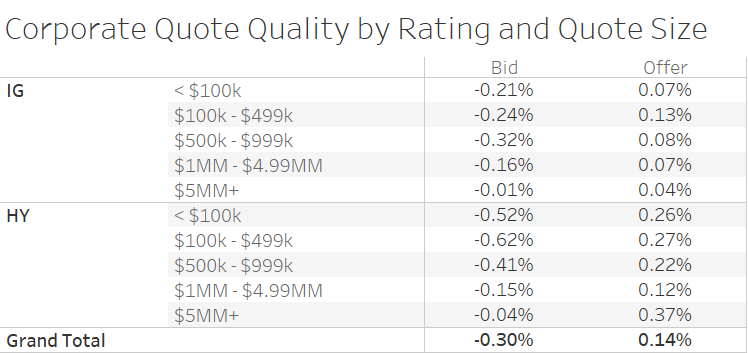
Source: FINRA, BondWave BDTI
Quote Quality by Rating and Trade and Quote Size
To examine the combined effects of quote size and trade size we organized the data into three groups: where the quote size is less than the trade size, where the quote size is equal to the trade size, and where the quote size is greater than the trade size. Most observations fall into the last category where the quote size is greater than the trade size. When organized in this fashion we see the same pattern. Regardless of the relative quote size to trade size the opportunity for price improvement exists across the board.
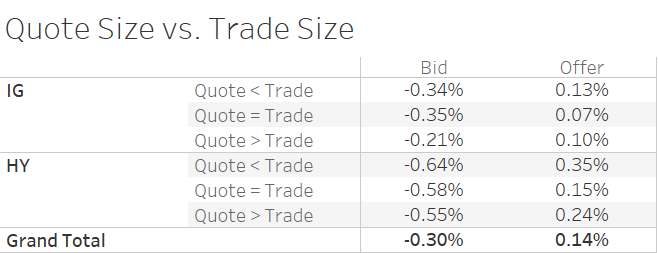
Source: FINRA, BondWave BDTI
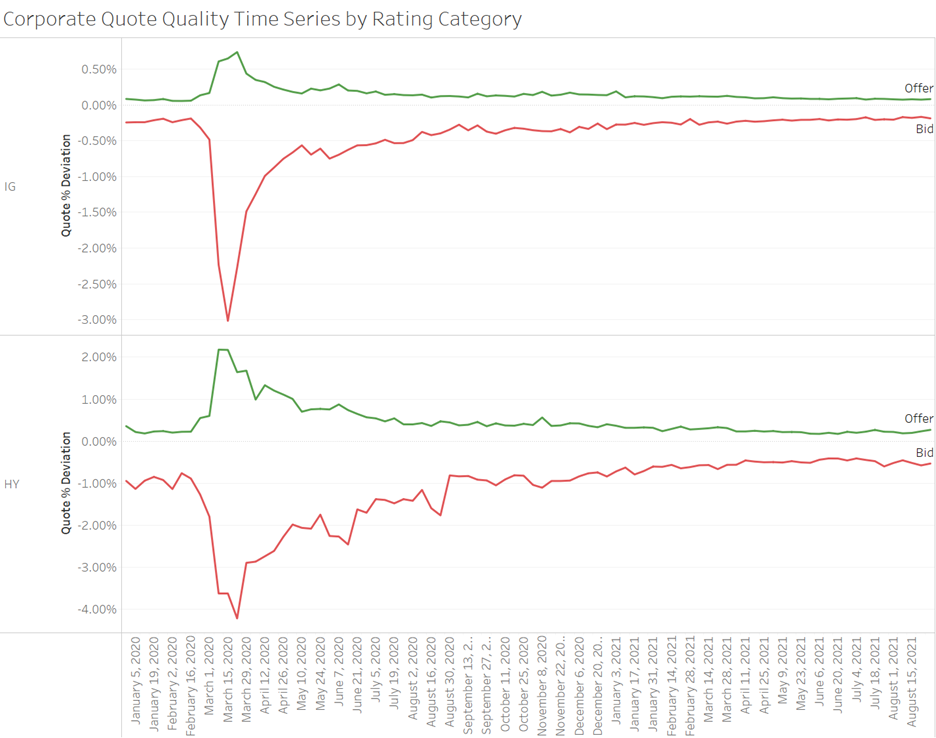
Quote Quality Time Series
The effect also persists through time. Each individual day in the time period exhibited the same pattern; on average trades occur at prices better than the best available quote. For the graphic below we also expanded the time frame to include all of 2020. We did not include 2020 in our prior analysis due to the excessive skew that pandemic quoting would introduce to all averages. While it is interesting to include 2020 in a time series, it is not valuable for making statements about market dynamics in normal environments.
Source: FINRA, BondWave BDTI
Electronic Market Making vs. Inventory Trading
As electronic trading has grown in recent years electronic market making has also grown. We wanted to understand if there was a difference in quote quality between electronic market makers and dealers who trade from inventory. For this purpose we consider an electronic market maker to be less likely to carry inventory positions (and therefore, less likely to reflect their inventory when quoting) than a dealer which carries inventory. We also need to acknowledge that at any point in time and for any CUSIP a single dealer may be acting more like an electronic market maker and less like an inventory trader, and vice versa. For example, a dealer may act as an electronic market maker by posting a two-sided market for 250 bonds of bond A for which it has no current inventory position. If a trade for 249 bonds executes against their bid, they are now likely to offer 249 bonds (rather than 250), making their offer size reflect their inventory position.
There is no indicator in either of our data sets that would indicate the nature of the activity that leads to liquidity provisioning. Instead we rely on an assumption about quote sizes that are more likely to be associated with electronic market making. We assume that quotes sizes of 50, 100, 200, and 250 are more likely to be associated with electronic market making than quote sizes that are slightly lower and slightly higher than those numbers.
For investment grade bonds, we created four bid size pairs and four offer size pairs based on these assumptions. In the first size pairing we compare quotes of 50 bonds to quotes of 41 to 49 and 51 to 59 bonds using our quote quality metric. We did the same for quotes of 100 bonds (comparing them to quotes of 91 to 99 and 101 to 109), 200 bonds (comparing them to quotes of 191 to 199 and 201 to 209), and 250 bonds (comparing them to quotes of 241 to 249 and 251 to 259).
| Center of Quote Size Pair | “Electronic Market Maker” Quote Size Included |
“Inventory Trader” Quote Size Included |
|---|---|---|
| 50 | 50 | 41, 42, 43, 44, 45, 46, 47, 48, 49, 51, 52, 53, 54, 55, 56, 57, 58, 59 |
| 100 | 100 | 91, 92, 93, 94, 95, 96, 97, 98, 99, 101, 102, 103, 104, 105, 106, 107, 108, 109 |
| 200 | 200 | 191, 192, 193, 194, 195, 196, 197, 198, 199, 201, 202, 203, 204, 205, 206, 207, 208, 209 |
| 250 | 250 | 241, 242, 243, 244, 245, 246, 247, 248, 249, 251, 252, 253, 254, 255, 256, 257, 258, 259 |
For bids we see that in all four pairings there is more price improvement captured (i.e. lower quote quality) for quote sizes associated with electronic market making than for quote sizes associated with inventory trading. The divergence is greatest in the pairing centered on 100 bonds.
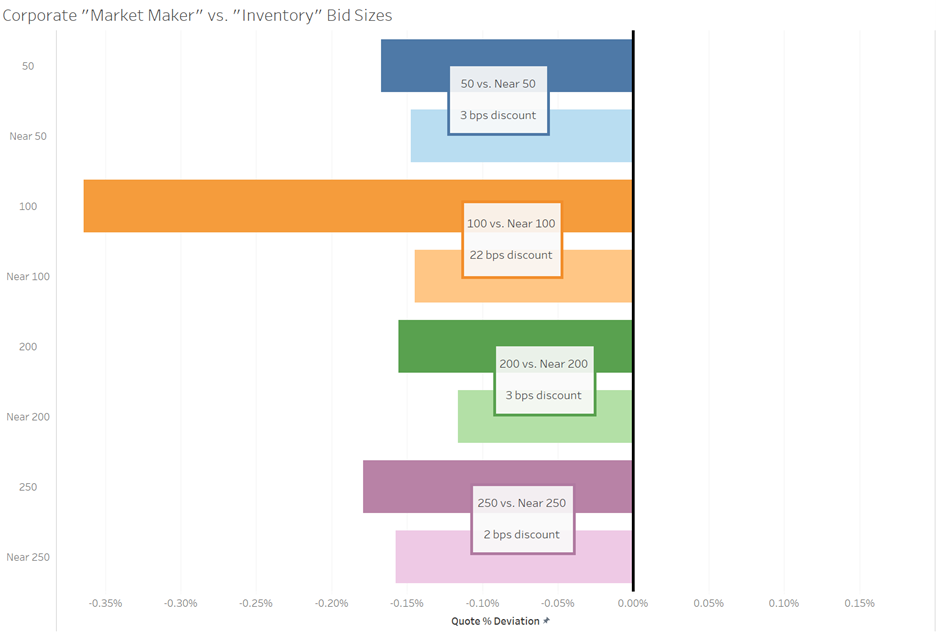
Source: FINRA, BondWave BDTI
For offers we also see that in all four pairings there is more price improvement captured (I.e. lower quote quality) for quote sizes associated with electronic market making than for quote sizes associated with inventory trading. The divergence is greatest in the pairings centered on 100 and 200 bonds.
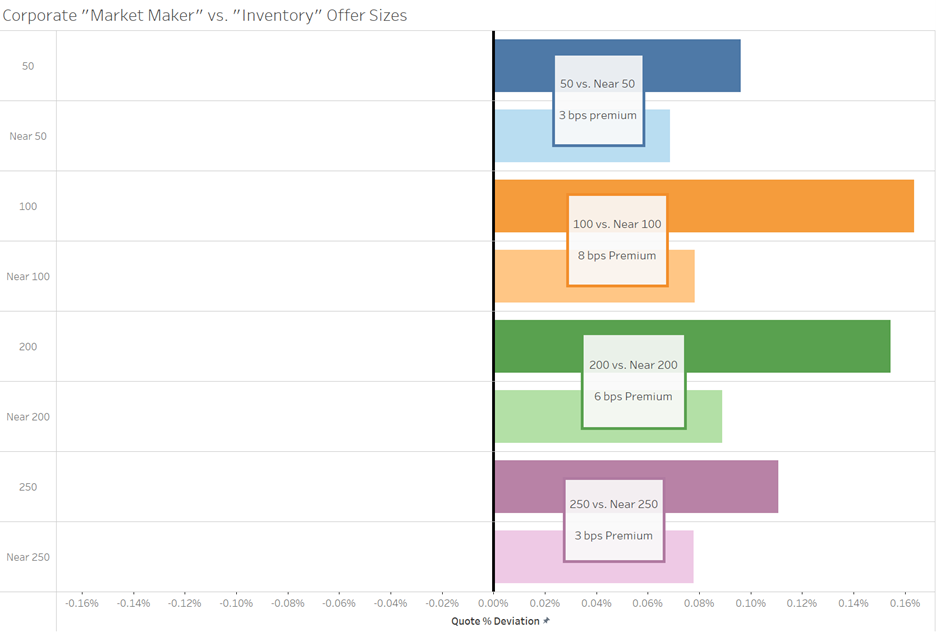
Source: FINRA, BondWave BDTI
Conclusion
While our quote quality study is limited based on a lack of publicly available consolidated quotes, we can draw the following conclusions based on our single ATS source of data:
- The vast majority of trades occur at prices better than the quotes.
Approximately, 80% of all trades (85.6% of sells and 73.3% of buys) occurred at prices better than the quote. And the effect is present across all subsets of the data (IG vs. HY, large vs. small trades, large vs. small quotes). - Bids tend to be of lower quality than offers.
Across the entire data set offers have more than twice the quality of bids (14 bps of price improvement for offers vs. 30 bps of price improvement for bids). - High yield bonds have lower quote quality than investment grade bonds.
With higher risk comes greater caution when posting bids and offers. The same phenomena with exaggerated effect can be seen in the times series data. During the height of the pandemic dealers widened their quotes beyond where they were willing to execute trades by hundreds of basis points. - Quote size is more closely associated with quote quality than trade size.
Larger quote sizes tend to reflect more accurately the prices at which dealers are ultimately willing to trade. - Quotes in “electronic market making” sizes tend to be lower quality than similar sized quotes.
Market participants who appear to be representing inventory positions in their quote sizes also appear to be placing more efficient quotes.
