Pictures Speak Volumes
Over a series of short articles BondWave will attempt to put the historic impact of current events on the bond market into pictures.
Riskless Principal Trading Impact
We always find it educational to study riskless principal trading. These are agency orders for brokers. While mechanically they pass through a broker’s principal account, they typically do not contribute significantly to a broker’s risk. These trades are not truly riskless. There is settlement risk. And in the current environment, settlement risk has grown.
To identify how the market has reacted to increased risk we first isolate all riskless principal trades on the tape. We then look at the subset that also has other, unrelated, dealer-to-dealer trading activity. We can back out the mark up on a trade from the difference between the dealer leg and the customer leg in the riskless principal pair. We can also compare the fill price of the dealer leg in the pair to the other fill prices that day in the dealer market to determine the quality of the dealer leg in the pair. That difference we are calling riskless principal impact.
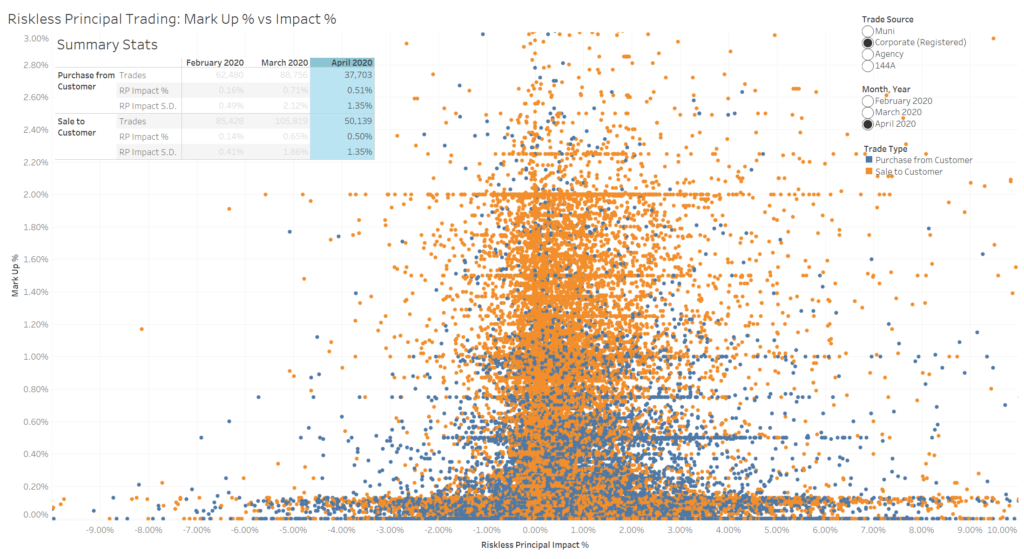
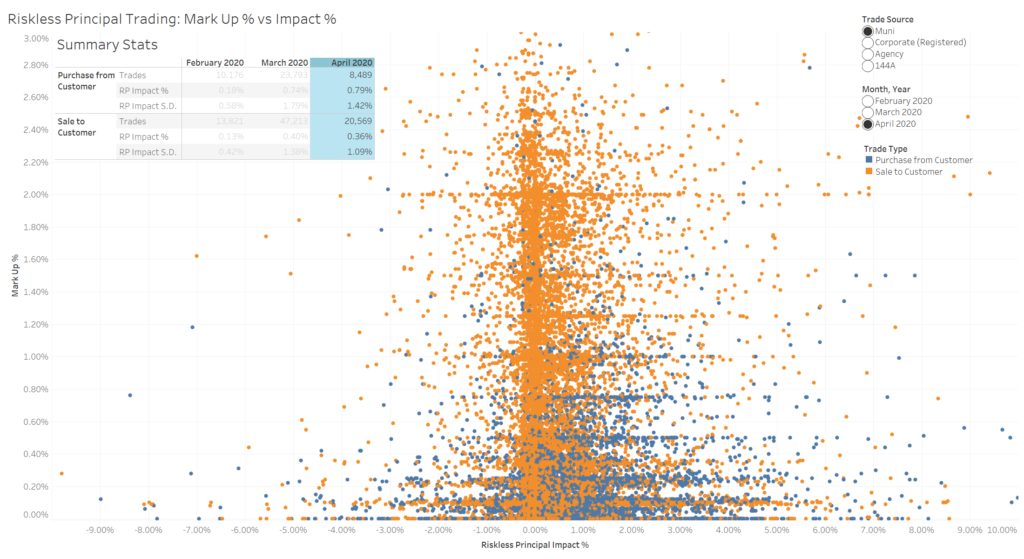
All graphs are sourced from reported trades to TRACE and EMMA along with BondWave proprietary data. The April 2020 data covers April 1 to April 15.
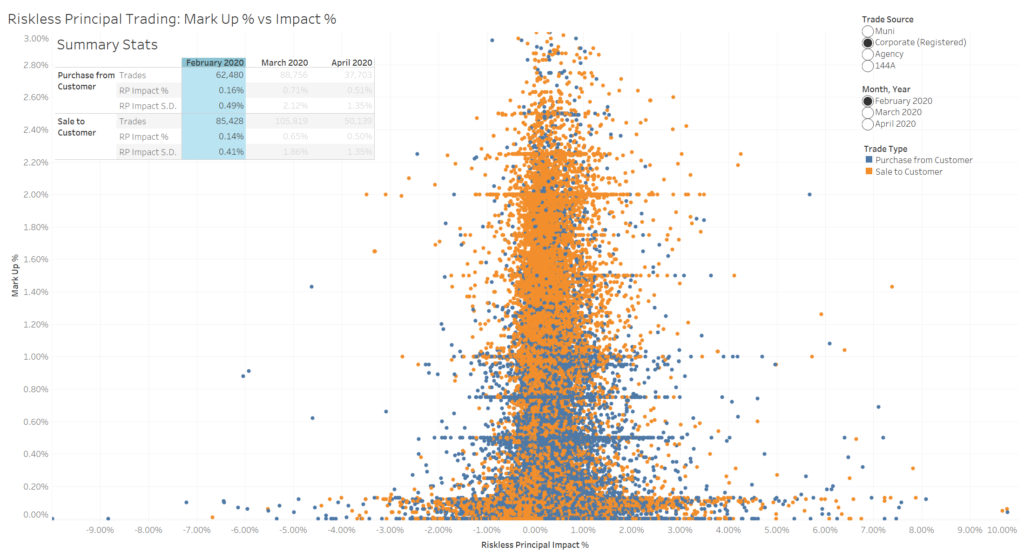
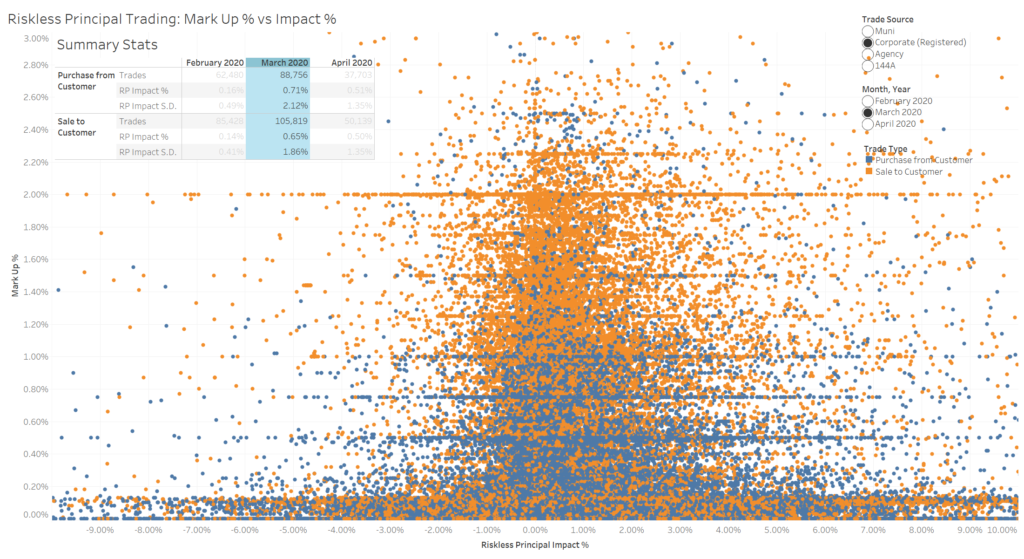
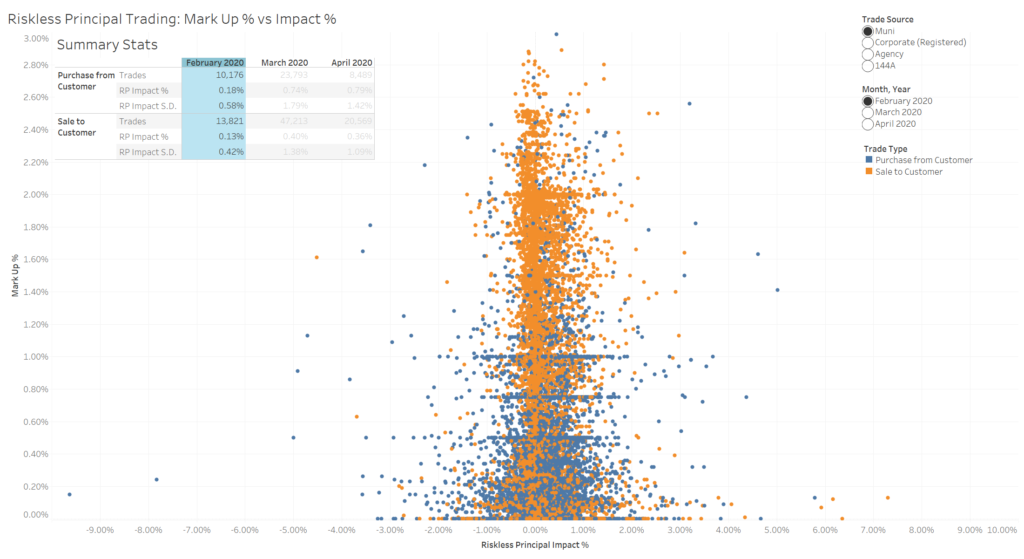
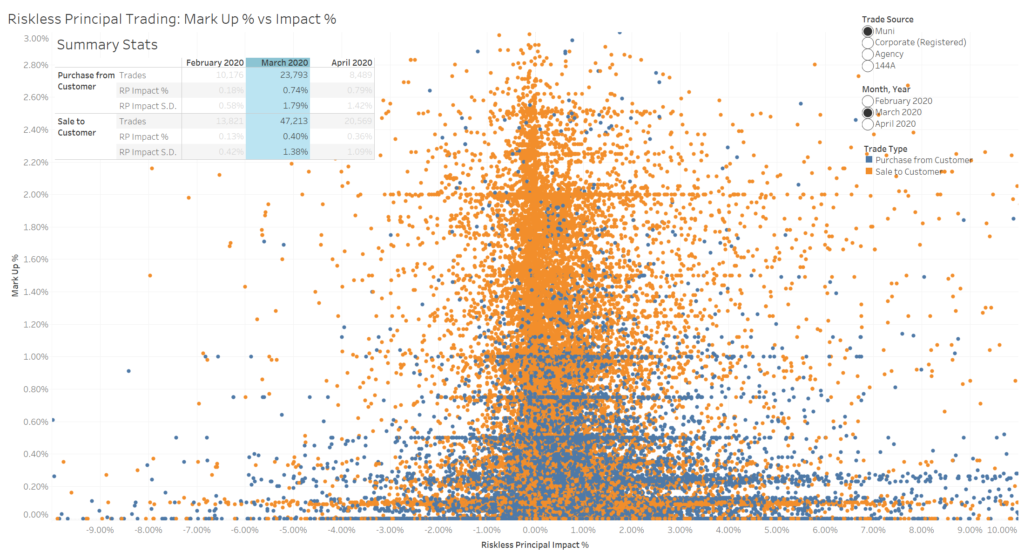
Included with each graph is a table listing the number of trades, the average percentage impact, and the standard deviation of the impact by side of market.
Corporate (Registered) Bonds
Municipal Bonds
Interpretation
One way to view the average riskless principal impact is that it can be a proxy for the bid-ask spread. In this data set we have made no attempt to side match dealer-to-dealer trades. As reported to the tape there is no side designation for dealer-to-dealer trades, so some of the trades being used in the comparisons will be on the same side of the market and some will be on the opposite side of the market. While BondWave uses a pattern detection algorithm to assign side of market to dealer-to-dealer trades in its Bid-Offer Spread Service (BOSS), we have made no attempt to do that here. In the absence of bid-ask spread adjustments we would expect the center of the distribution to be skewed to the right. The bid-ask spread causes the average cost of trading to be greater than zero, just as it causes the average return to market making to be greater than zero.
Another way to view the data is that when there are multiple trades of a type on a single day some will be better than the average and some will be worse. That may be a statement about the relative skill of the traders involved or it might be a statement about market movement. It is likely that it is a statement about both. But the relative weights of the two statements can change over time. When the market is quiet and there is no new information that needs to be incorporated into the price of a bond, differences in execution really are a statement about execution quality. That is at least in part due to the weak nature of price discovery for fixed income instruments. With little to no pre-trade transparency and delayed, error prone trade reporting “knowing” the correct price is challenging. When a weak price discovery process is stressed, the results become more unstable. It is difficult to incorporate modest changes of information in quiet times, but it becomes exceedingly difficult, and subject to widely varied opinions, to incorporate massive and uncertain changes in information. March 2020 is a perfect example of massive, uncertain changes in information being introduced into the marketplace. This is reflected not just in the increased average riskless principal impact, but also in the large increase to the volatility of this measure.
