Transportation Bonds Make a Move
Municipal bonds have been struggling to find steady ground as COVID-19 pandemic continues to unfold. March 9th to March 24th was easily the most unusual and volatile period muni bonds have experienced in recent years. We can roughly segment the current year into three distinct groups as it relates to municipal bond volatility – January 2nd to March 8th, March 9th to 24th and March 25th to present – referred to as ‘Before’, ‘During’ and ‘After’ for the rest of this write-up. It is important to remember that all three timeframes represent different numbers of trading days.
Trade Activity Summary
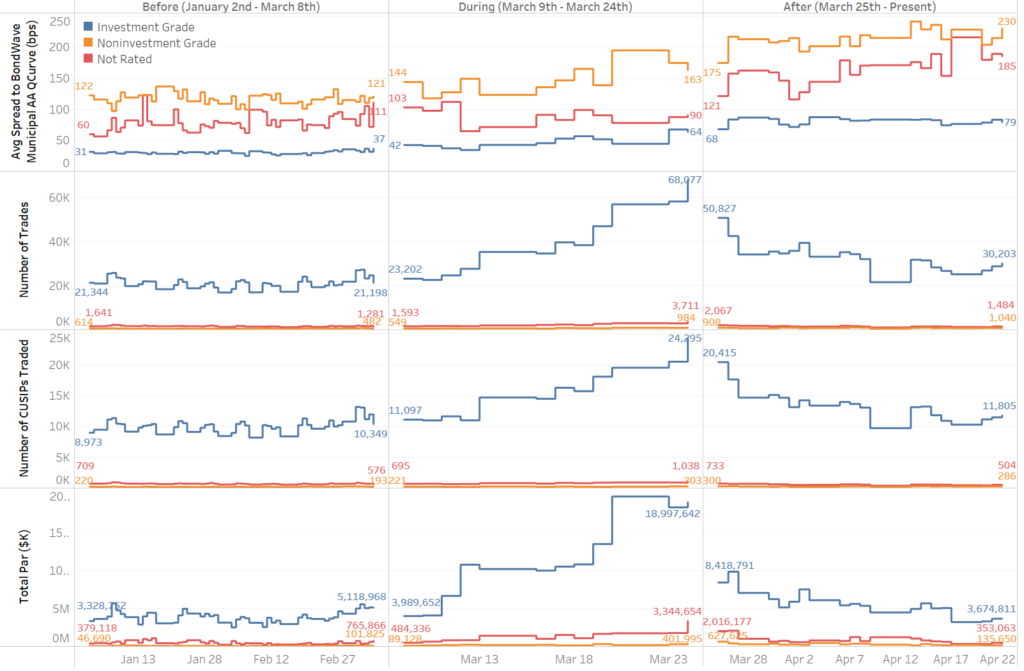
In all three timeframes, investment grade bonds trade most often, and exhibit the lowest Average Spread to the BondWave Municipal AA QCurve of all rating categories. By March 24th, the daily number of investment grade trades had increased to more than three times the number on March 6th. However, as of April 22nd, with 30,203 investment grade trades, activity has reverted to levels near those seen in the Before period.
On the other hand, spreads to the BondWave Municipal AA QCurve seem to have remained elevated as can be observed from the topmost section of the graph above. Investment grade spreads started off the year (January 2nd, 2020) at 31 bps and have risen steadily to 79 bps as of April 22nd, 2020. Non-investment grade bond spreads are at 230 bps as of April 22nd, nearly double the spreads seen on January 2nd (122 bps).
The Driving Force Behind Spread Movement
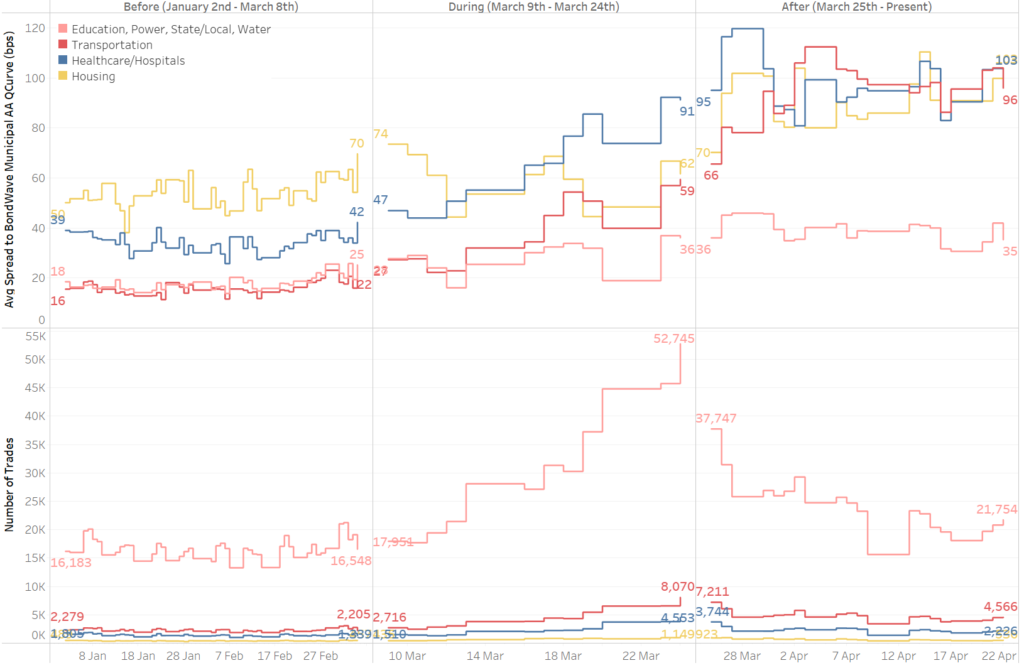
To find the driving force behind the rise in spreads, we sliced municipal trade data by sectors. Our data shows that while spreads have risen across all sectors since March 9th, transportation bonds have categorically migrated from a group of sectors considered relatively safe (Education, Power, State/Local, Water) to a group that is considered inherently riskier (Healthcare/Hospitals and Housing). This was particularly evident in investment grade bonds as represented in the graph below. The top half of this graph plots Average Spread to the BondWave Municipal AA QCurve (in bps) and the bottom half provides the depth of underlying data as measured by the number of trades.
Transportation bonds’ spreads began to increase around March 9th from 27 bps and reached their peak so far at 112 bps on April 3rd. After trading in line with Education, Power, State/Local and Water bonds in the early part of the year, transportation bonds are now trading at spreads similar to those of Housing and Healthcare/Hospital bonds.
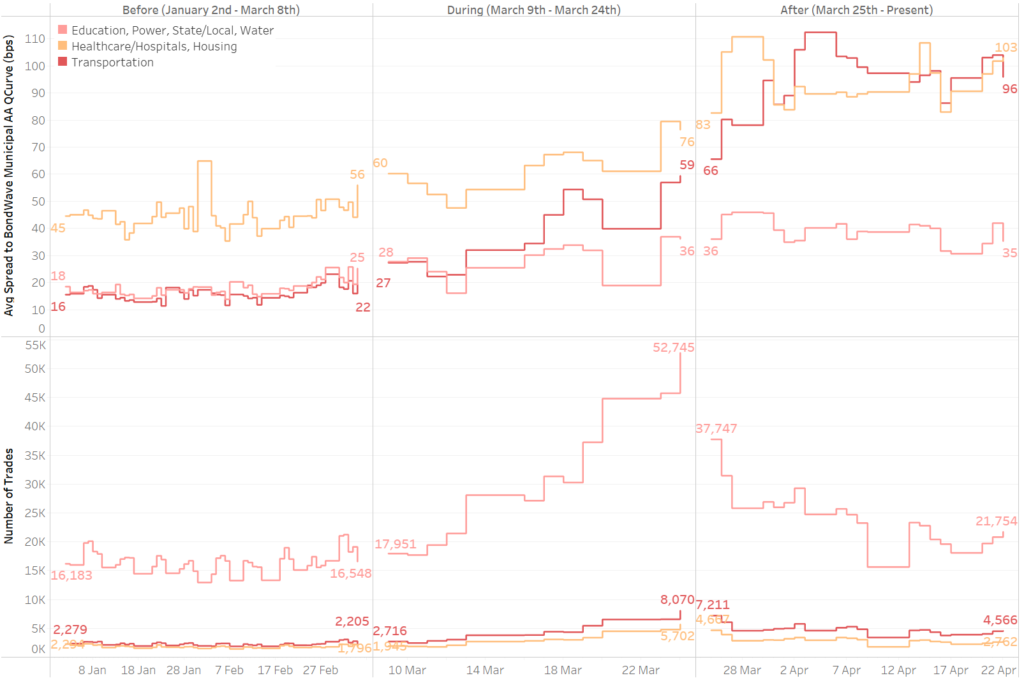
But however true and significant this is, healthcare and hospital bonds were also the first responders in a volatile market. In a pandemic scenario this should not come as a surprise. We can see this clearly by separating Healthcare/Hospitals from Housing in the graph below. Spreads of healthcare and hospital bonds began rising around March 9th. The average spread for these bonds went from 47 bps on March 9th to its highest point so far at 120 bps on March 27th. It is only in our After period that spreads in the other risky sectors catch up with healthcare and hospital bonds.