The Muni/Treasury Ratio Remains Inverted and Volatile
Bonds continued to respond rapidly to the economic and trading activity since our last update on Muni/Treasury ratio on March 17th. BondWave AA Muni QCurve captures intraday trading activity of AA rated municipal securities representing more than 49% of trade volume on any given day.
Muni Curve Flattening
Even after the municipal market rally over the past two days, municipal bonds maintained the recent relative rise in yields, as it has been a remarkably volatile time this month. Municipal trading activity increased significantly, and the yield curve flattened rapidly with 5-year yields closely following 10-year yields. The difference between 10-year and 5-year yields dipped as low as 7 bps earlier this month, down from nearly 40 bps at the beginning of this year. After a two day rally, at the close of March 26th the 5-year BondWave AA QCurve Yield stood at 2.40%, while the 10-year was at 2.58%.
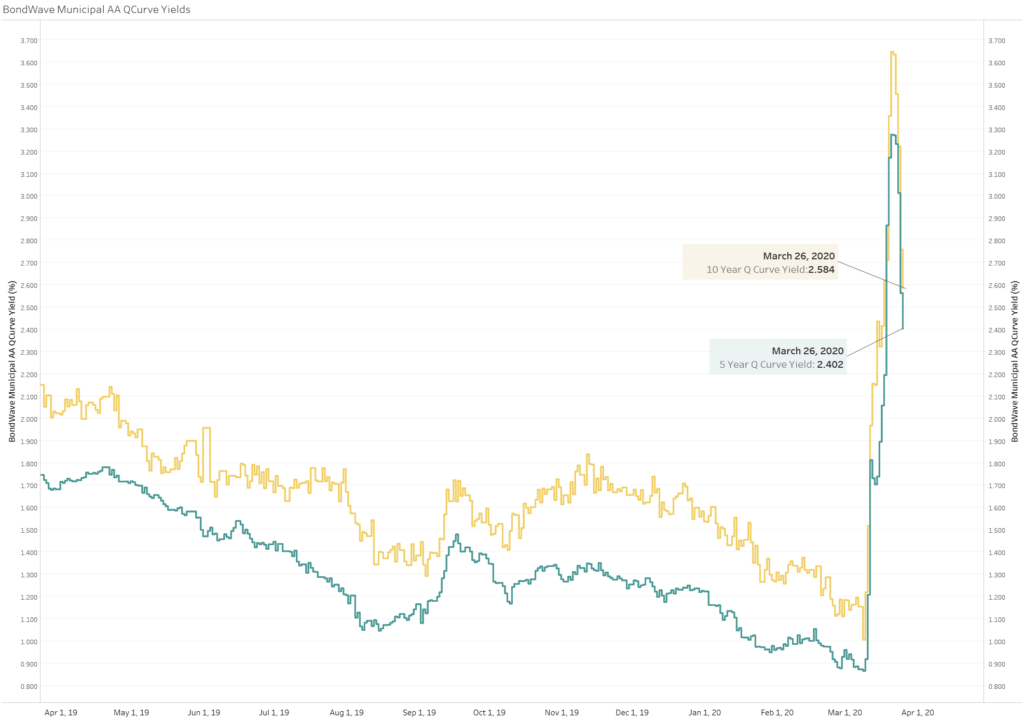
Source: BondWave
Muni/Treasury Yield Ratio Inverts
As the market scrambles to find steady ground, the Muni/Treasury ratio continues to remain inverted and at extraordinarily high levels compared to its long-term average of approximately 90%. 5-year QCurve Yield steadily climbed up from 2.19% on March 18th to 3.23% on Monday, March 23rd, sending 5-year Muni/Treasury ratio soaring to nearly 850% that day. By the end of day on March 26th, the 5-year Muni/Treasury ratio declined to 463% (QCurve Yield at 2.40% and Treasury at 0.52%) and the 10-year Muni/Treasury ratio declined to 300% (QCurve Yield at 2.58 % and Treasury at 0.86%).
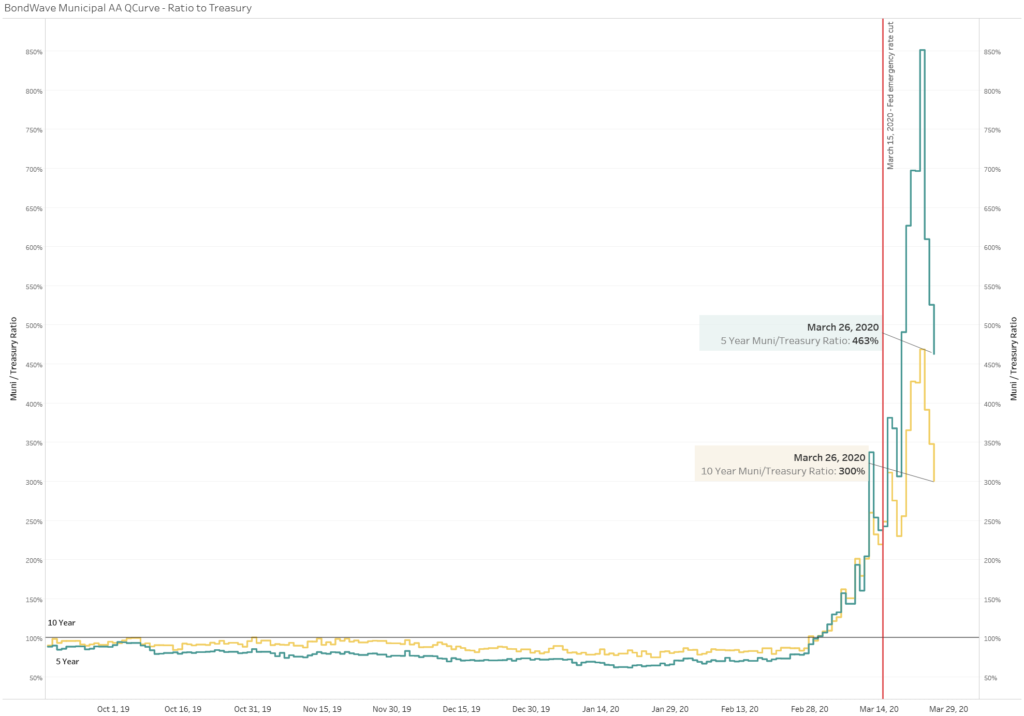
Source: BondWave
