The need for dependable financial benchmarks cannot be overstated given the recent LIBOR debacle which resulted in an FCA mandate for the replacement of LIBOR by the end of 2021. A reliable benchmark needs to be firmly and quantitatively grounded in the economic realities of the market it aims to represent.
We feel there is a three-part test of what constitutes such a yield curve:
- Transparency: Can the users seamlessly assess the data which go into a yield curve calculation to evaluate the validity and quality of the yield?
- Quality of the Methodology: Is the yield curve calculation process easy to explain and easy to understand? Is it logical?
- Adequacy of the Underlying Data: Is the scope of the yield curve wide enough? Does the yield curve have meaning in the context of underlying securities? Does it sufficiently represent the area of the market it intends to measure?
In this data dive we examine an important element of municipal yield curves: the choice of a AAA benchmark. Does this choice pass the test?
According to the Principles of Financial Benchmarks (published in 2013 by The Board of the International Organization of Securities Commissions), benchmarks should be based on prices or rates determined by observable transactions and the competitive supply and demand forces of the market.
In our previous post on LIBOR, we have discussed the lack of transparency in a poll based yield curve. SONIA (Sterling Overnight Index Average), a transaction based index, is set to replace a survey based LIBOR.
In the past, it made sense for survey based municipal yield curves to be the norm due to the unavailability of robust transaction data. However, real-time transaction reporting and MSRB’s EMMA portal have brought municipal trade data to our fingertips. Simultaneously, our ability to efficiently process large amounts of data has been increasing exponentially in recent years. Yet, despite these advances, the most popular municipal benchmarks surprisingly remain poll based.
We see no obvious reason for the municipal yield curves to not be quantitative. In this data deep dive we will use publicly available municipal trade data to see why the market should leave the narrows of a AAA benchmark and adopt a more stable and quantitative AA benchmark.
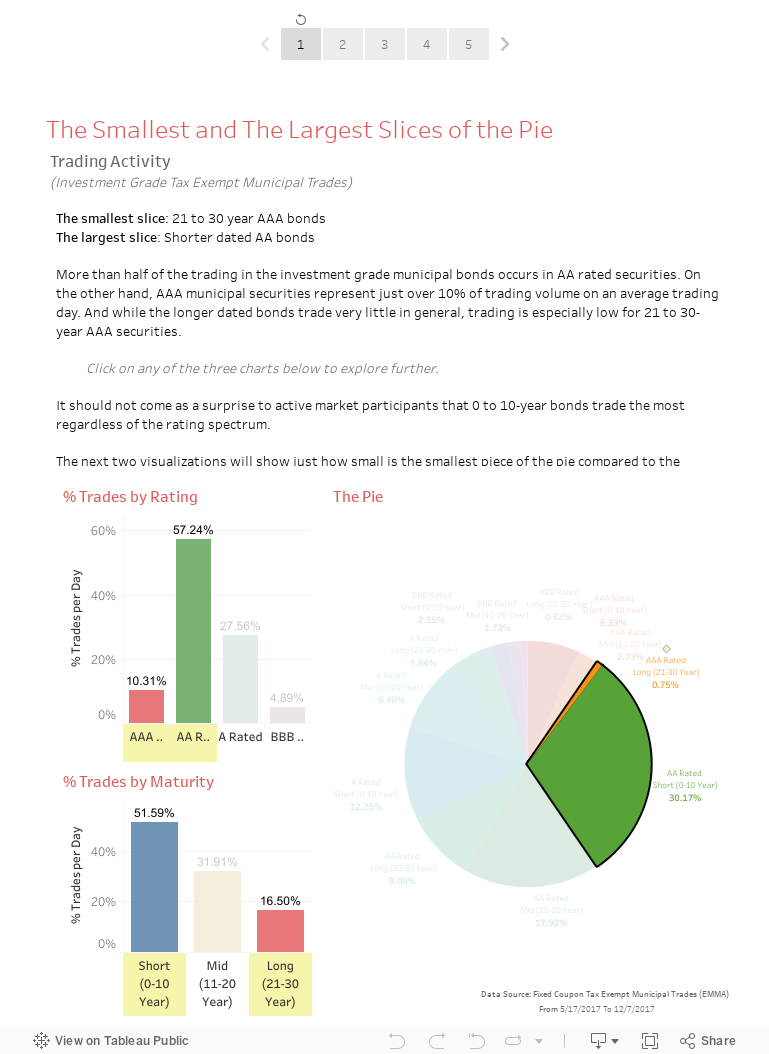
Higher volumes of transaction data create greater stability in measuring the yields thus leading to a consensus faster, which makes for a better benchmark. With AA rated municipal bond trading swamping AAA rated municipal bond trading, it is time we recognize this pattern and move to a AA municipal bond yield curve.
